
Charts in Excel are used for the purpose of conveying valuable information. However, most people struggle with exporting charts in excel. To use these charts in other places, the best thing you can do is to save them as images first. In the following paragraphs, we will discuss how to export image charts in Excel.
So, let’s begin.
Method # 1: Take a Screenshot
One of the most common methods to export image charts in Excel is to take a screenshot. It is totally up to you whether you go for a third party screenshot tool or the built-in tool in your computer system. It is a no-brainer that using the tool in your computer is easier and less time consuming, but the choice is yours. Here is how you can save the chart and take a screenshot:
If you need to convert charts to images, you can check out our guide!
- Press the “print screen” button on your keyboard.
- Now go to Paint on your computer.
- Once you have opened Paint, press “CTRL+V”. When you do this, the image will automatically be pasted for you to carry on with the task.
- Now, you have to crop the image, but make sure to cut the chart only.
- After the chart has been selected, go to the crop button and crop the chart. Hence, only the chart in your image will remain. Now using the multiple tools in Paint, you can edit your image.
- After the chart has been edited, you need to save it. It is up to you which image type you would like to select in the Save As window.
Remember that you are not bound to use the paint tool on your computer. You can install any other image editing software. Almost all of them can edit images and save them with different file types. Once you have edited the image, you can use it wherever you want.
Method # 2: Save Pictures Through Word
In this part, we will take a look at saving image charts through Word.
- Create your charts.
- Now, you need to press the shortcut key “Ctrl C”.
- Now, open a new Word file.
- Paste the image into the new word file that you have just opened.
- Under the Paste button, there will be a small arrow— press it.
- When you press the arrow, a drop down menu will open. From that menu, click on “Picture”.
- As a result, your chart will appear in word in the form of an image.
- You may want to choose a specific type. If that is the case, click on the “Paste Special” option in this very step.
- In the end, press “OK”. As a result, the image will automatically be pasted into your word file.
- To edit this image, you can use the built-in picture tools in word.
- To save this image, right click on the image and press Save As.
- When the menu opens in front of you, select the “Save as Picture” option.
- In the image saving window, follow the path you need and input a specific name for the picture.
- In the save as window, you have the option to choose from any one of the 5 options available.
- The chart will be saved on your computer as an image file and you can use it as you wish.
Method # 3: Save Workbook as a Webpage
The third way of exporting image charts in Excel, is to save the Excel Workbook as a webpage.
For this:
- Click “file” on Microsoft Excel after all the charts are ready.
- Then click the “Save As” option.
- Now a separate menu will pop up in front of you. Look for the “Save as Type” tab. From the drop down menu, you have to choose “webpage”. In the window, you need to input the path and type.
- Then click Save.
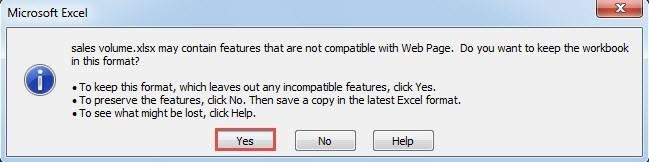
- When you do, you will see the following window. This has to do with compatibility. Here you need to click “Yes”. Thus, the file will be saved as a webpage on your computer.
- After you click “Yes,” open up the path you have saved as your webpage. In the folder, you will come across a new folder named “suffix files”. This folder will be created automatically by the computer when you save excel as a webpage.
- When you open this particular folder, you will come across all the chart images already saved. Then you can easily choose the chart image you are looking for.
- You may also find that all the chart images are in the PNG format. If you want to save them as other files, you might have to resort to a third party image processing tool.
Last Few Words
By now you must have understood how to export image charts in excel. With time, excel is becoming more and more important in our professional lives. However, you need to be careful as it is also subject to corruption in one form or another.
If you are on the lookout for a professional chart making service, check out what Image-Charts has to offer.


