
Let’s take a trip down memory lane. Remember the fighting games you played as a kid? How did you know your character was about to die and it was time to bring out all those flashy moves? By the health bar that shows up on top.
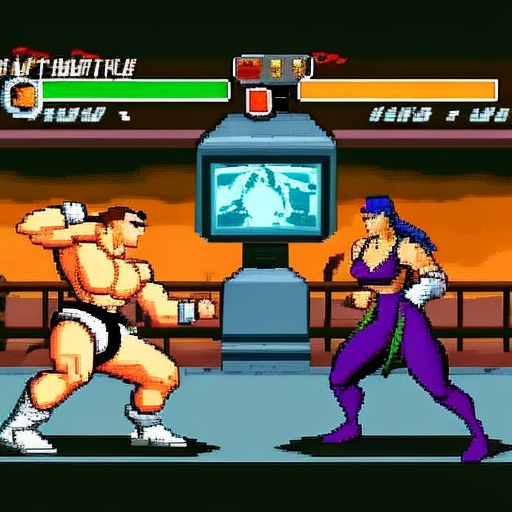
The game starts with each player with a limited amount of health represented by a bar. Every time a character takes a hit, the bar docks off some health until it “empties” and the other character wins.
That was probably the first progress bar you experienced.
Progress bars in the business world work the same way, except that instead of going max-to-null, they go null-to-max (and no epic fatalities).
A progress chart is super handy for tracking progress or changes over time. They show how you or someone else is doing in a way that’s quick and easy to understand. I mean, seriously, which of the following would you prefer adding to a report for your boss when they ask for quick insights?

Unless your boss really hates charts of all types, we’d place our bets on the first.
But let’s go back to the beginning.
What are Progress Bar Charts?
Basically, a progress chart shows your progress over time using a bar graph. For example, if you’re trying to run a mile under a certain time, your progress chart would show your running times over a period of days or weeks. You could see if you’re improving or if you need to work harder to hit your goal.
But progress charts aren’t just for personal goals. They’re also used by businesses to track their performance, by teachers to track their students’ progress, and by project managers to track their team’s progress. They’re also a great way to show a customer the status of their loyalty points via email!
The cool thing about progress charts is that they help you visualize the data in a very digestible way. You can quickly see if you’re on track to hit your goal or if you need to make some adjustments. Plus, progress charts can be a great motivator—seeing your progress over time can be really encouraging!
And now, to the FUN part—how to CREATE one?
How to Create a Progress Bar Chart in Image Charts?
In design terms, Progress bars are nothing more than horizontal bar charts with negative margins. And in Image Charts, they’re really easy to set up. Here’s how to do this on the free Image Charts Editor:
How-To Option #1: Free Editor
1. Choose your main color
First, choose your main color (that shows progress) and the background color (preferably a neutral one). For this example, we will take a gold color #CFB948 as our main and a simple light gray #E3E3E3 as the background.
2. Setup the settings
Now pick the following settings:
- cht=bhs (horizontal stacked bar chart)
- chma=-10,0,0,-10 (left_margin: -10px, bottom_margin: -10px)
- chd=a:65|35 (65% progress done, 35% left)
- chxt= x,y (visible axis)
- chxs= 0,FFFFFF00,0,-1,_,FFFFFF00,FFFFFF00|1,FFFFFF00,0,-1,_,FFFFFF00,FFFFFF00 (for color and style of axis labels)
- chco=CFB948,E3E3E3 (set colors)
- chf= bg,s,E3E3E3 (set the solid fills)
Aaaaaand you’re done! Your resulting progress bar will look like this:

3. Celebrate (or make it EPIC)
Okay, now let’s crank up the charts fun. How about we create one with a gradient? Let’s say we want to display some progress from a bad state to a good state and express this with color.
The process would be exactly the same as above, except for one small detail in the solid fill. Let’s take an example.

- The first background fill bg,s,FFFFFF00, tells our API to render the chart with a transparent background color.
- The second background fill b0,lg,0,03A9F4,0.5,EA469E,0.1, tells that the first bar from our chart (b0), must have a linear gradient (lg) with a 0 degrees angle (0) starting from color 03A9F4 to color EA469E. Read all the techy details about gradients right here.
The resulting chart will be this beauty:

How-to Option #2: No-Code
Okay, all of this is great, but what if you don’t want to create progress charts manually? What if you have a recurring need and making these over and over is just wasting your time?
Well, there’s good news for you!
Image Charts integrates with Zapier and Make, so you can create progress charts with no code!
Here’s how your process would look in Zapier if you picked values from new records in Airtable, created a progress bar chart, and sent it to your audience using SendGrid. (Quick note - Zapier and Make integrations are only included in paid plans)
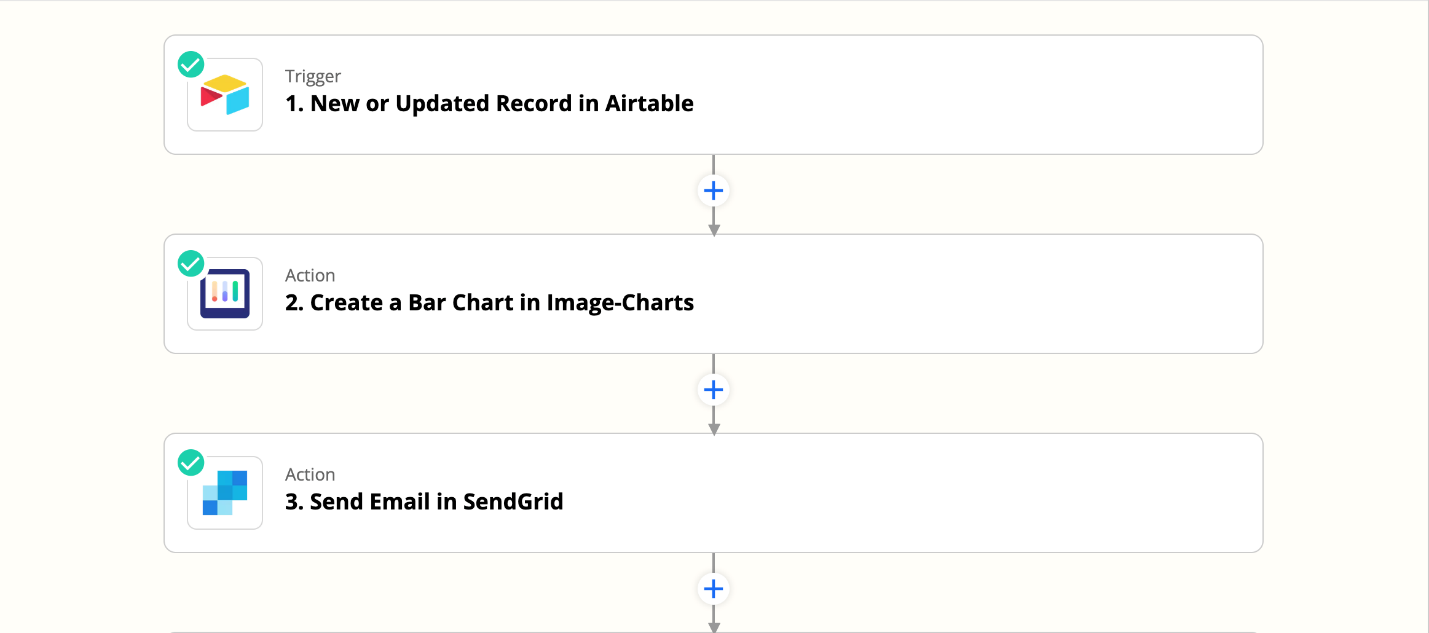
You can set up any action to trigger (progress) bar chart creation
Simply:
- Choose your progress bar chart trigger
- Choose the Image Charts app and select horizontal stacked bar chart (bhs) from the dropdown options.
- Indicate what data you want to show in the progress bar and how you want it to look (make sure to make the margins negative!)
- Decide where you want to display the final chart. You can send it in a transactional email, embed it in the product dashboard, showcase it on the website, or do something entirely your own!
Ta-daaa! Now every time the automation is triggered, a new progress bar chart will be created and sent wherever required.
And there you have it! Here’s how you can easily create progress bars with Image Charts. Try it out and build your a chart for free.


