
If you’re ready to start making and sending quality customized charts, you’re ready to get started with Image Charts.
Image Charts is an always up, always up-to-date, chart generation service that does the hard work of making and updating splendid embedded charts and graphs for you with a customized API. Set it up just once, and start telling the story of your data with auto-updated customized charts. Never waste time on lackluster graphs again.
Watch this video for a full tutorial or scroll down to see the instructions in written form. Happy charting!
How to Choose a Chart Endpoint
There are 2 different endpoints with Image Charts: /Chart and /Chart 2.8.0.
While the steps to use each are very similar, one is more developer-friendly while the other is more accessible to everyone.
The /Chart 2.8.0 endpoint is geared towards developers familiar with chart-js. If code isn’t your thing, the /Chart endpoint which gives you the ability to achieve that same level of customization. Both give you access to beautiful embedded and auto-updating charts.
How to Use the /Chart 2.8.0 Endpoint
The /Chart 2.8.0 API endpoint is simple but requires knowledge of the chart-js library.
Simply start by opening the drop-down menu, and select /Chart 2.8.0.
From here, you will be able to use chart-js library to create your graph.
How to use the /Chart Endpoint
The /Chart endpoint is for those less familiar with coding, or just want to make their charts quickly and easily.

Alt Text - selecting chart endpoint
Once you’ve chosen your endpoint, follow these steps to create your chart
Creating Your Custom Embedded Chart
Do you prefer to walk through steps instead of read them? Here's a live tutorial. Otherwise, scroll down for the step-by-step instructions.
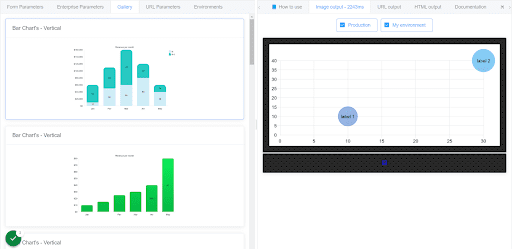
Select a Chart
Start by making sure you have /Chart selected in the drop-down menu. Then look to the top of your screen and select Gallery. Here you will select a chart and pre-fill data that you can edit later.
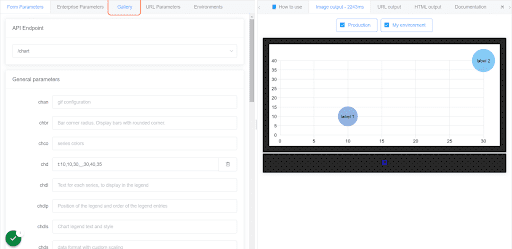

Alt Text - selecting chart type
Edit in Form Parameters
Once your chart type is selected, go back to Form Parameters in the far left tab at the top of the screen. Here you will find the blocks relevant to your select chart are already populated with test data. (Remember, if you want to switch chart type, just go back to the gallery.)
Simply change the data in the blocks on your left, and the chart will automatically update. Additionally, here you can change the name of your data set.
From here you can scroll down to your second data set, and change the labels. Further down you will be able to change the chart size in pixels. Below that, you will be able to change chart types without losing your data.
And below that, you will be able to rename the X-Axis.
Enterprise Parameters (Paid Feature)
For paid plans, check out the Enterprise Parameters tab at the top. Here you will be toggle Enterprise Mode.
Once toggled, you will be able to edit the font family and font family syntax and enable high-resolution images.
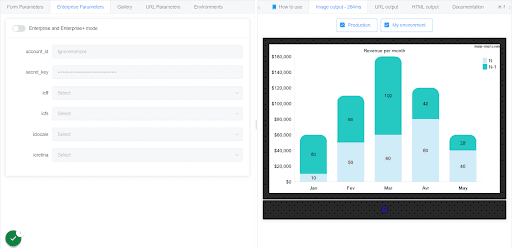
Alt Text - enabling Enterprise parameters
URL Parameters
To view the URL Parameters of the chart you have created, simply click the tab of the same name at the top of the screen.
Environments (Paid Feature)
If you’re utilizing Image Charts’ on-premise offer, you’ll be to use the Environments tab to control the beginning of your chart’s URL.
Simply click Add New Environment, edit, and save. The default is “Production.”

Alt Text - adding an environment
Grab the URL for Emails and Documents
Now, on the right side of your window, select URL output. Here you will be able to copy the provided URL to add your chart to an email or document.
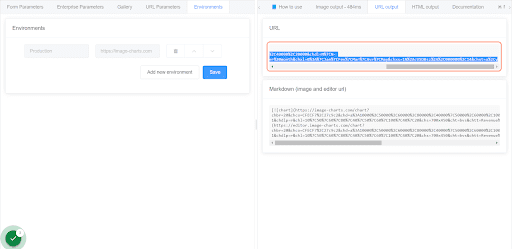
Grab the HTML to Embed on Websites.
If you’re looking to embed your chart on your website, select HTML output. Simply use the top embed code to display your new graph on your website.
For those embedding in markdown, select the second code.
How to Auto-Create Charts in an Email with Zapier
For those with Enterprise subscriptions, Image Charts provides Zapier and Make Integration.
Here we will see how to set up a trigger and action to auto-create charts in Email with Zapier.

Alt Text - Image-chart in your inbox
Pull Chart Input from Anywhere
Begin by selecting where your chart input is coming from. For this example, we’re using Typeform.
Under app event, choose your source. This will take form data as chart input.
Trigger Stage: Choose App and Event
Every time this form is submitted, a chart will be automatically created using Image Charts.
Select your event, and click continue.

Choose Account
Connect your Typeform account (or whatever you choose) to Zapier by clicking the form name you want to use.
Click Continue.
Alt Text - setting up Typeform trigger
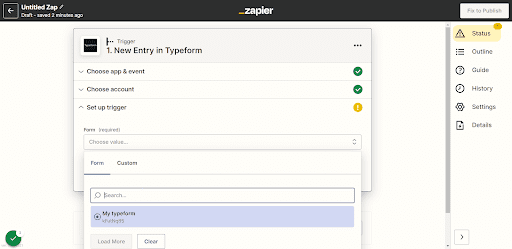
Set up Trigger
Again, click on the form name you would like to use and continue.
Alt Text - selecting form name
Test Trigger
Here we can review the responses. Once again, click continue.
From here we’re finished setting up Typeform, and now we’ll start on setting up Image Charts.
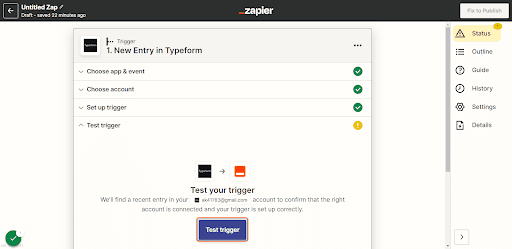
Alt Text - testing form trigger
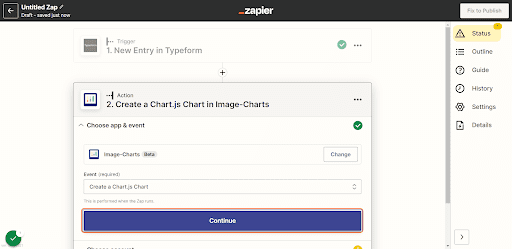
Action Stage: Choose App & Event
Here we will select Image Charts as the next step in the automation.
Then we will select Create a Chart.js Chart in the dropdown menu.
Click Continue.
Alt Text - creating Chart.js Chart type
Choose Account
Choose your Image Charts account. Here you will enter your Image Chart login information.
Set up Action
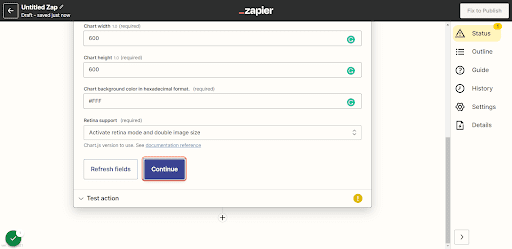
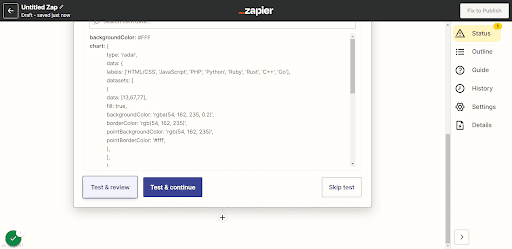
Here we will copy the entire code in chart.js configuration except for the data block. Then under version select Chart.js version 2.8.8.
The variables for version, chart width, chart height, and chart background color are pre-decided in Image Charts. Enter the same values in the respective fields now.
Click Continue.
Test Automation
You will now see the URL of your chart that will be used to embed it in your automated emails.
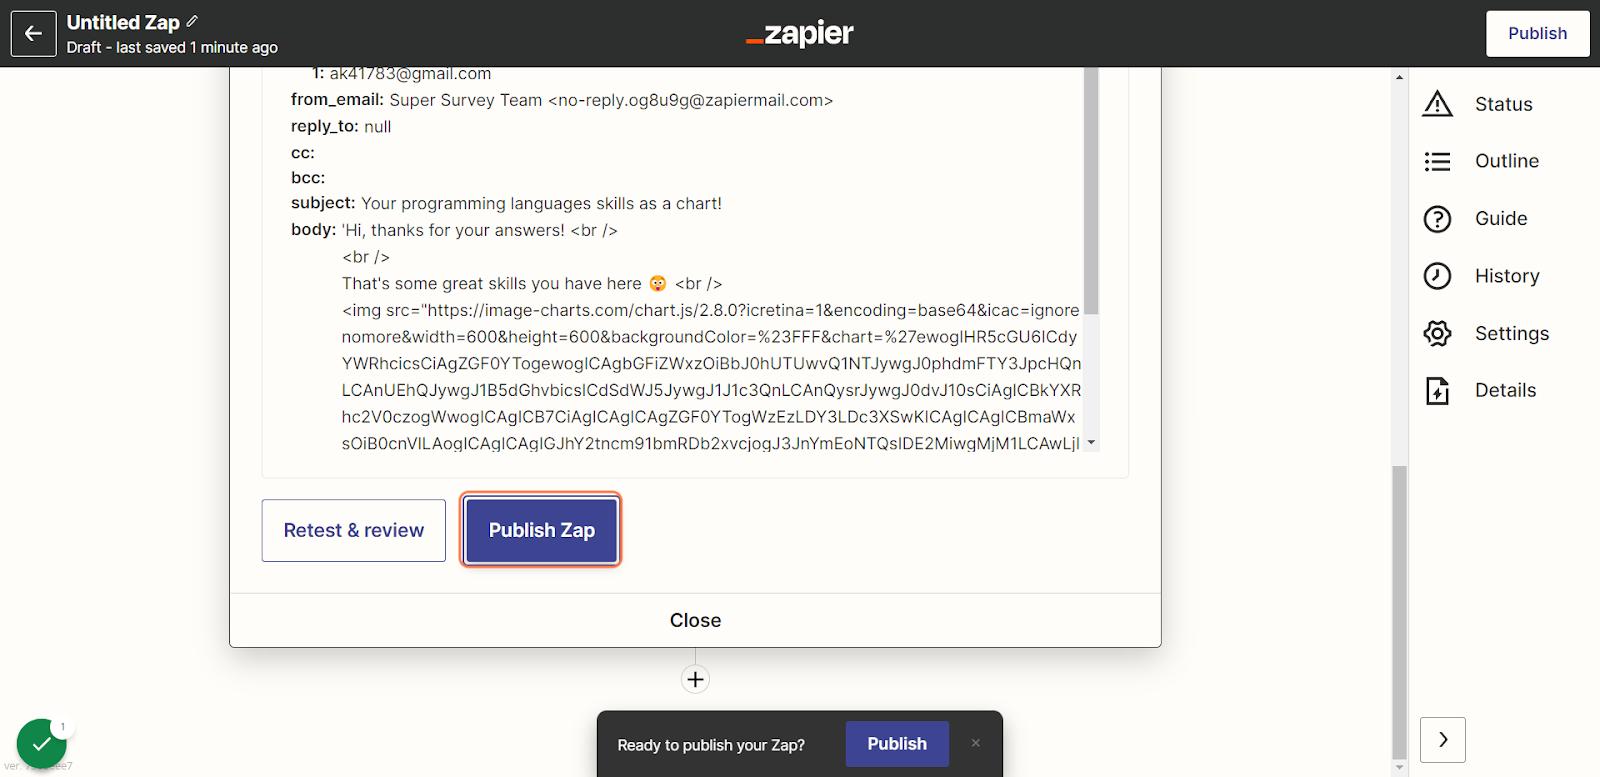
Now it’s time to test the automation. Select Retest & Review.
If successful, click continue.
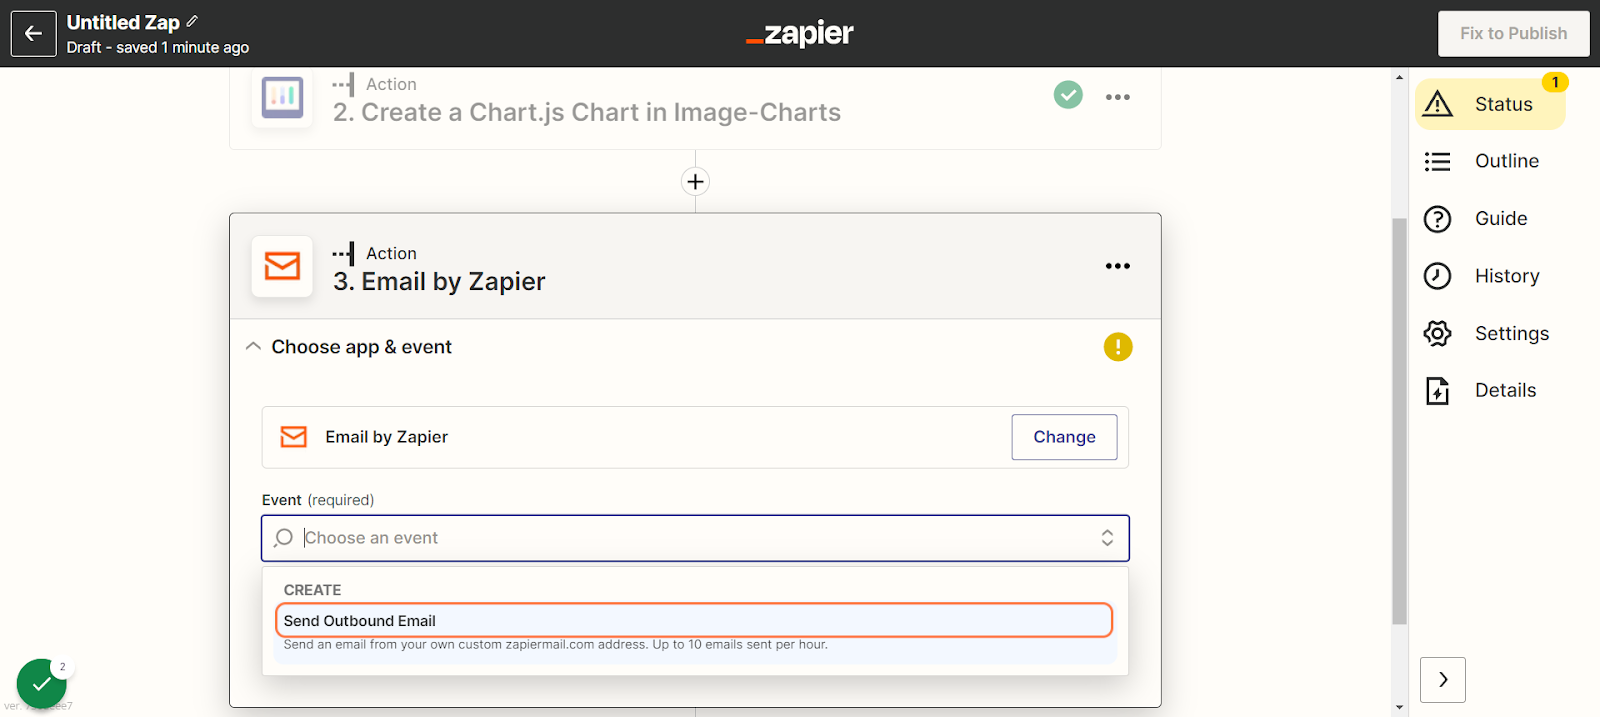
Send the Outbound email with Zapier
Adding Email by Zapier is the easiest way to send an email with an embedded chart. You can also use MailChimp, Gmail, or any other email service.
Choose email by Zapier now.

Then Send an outbound email as the trigger from the event drop-down menu.
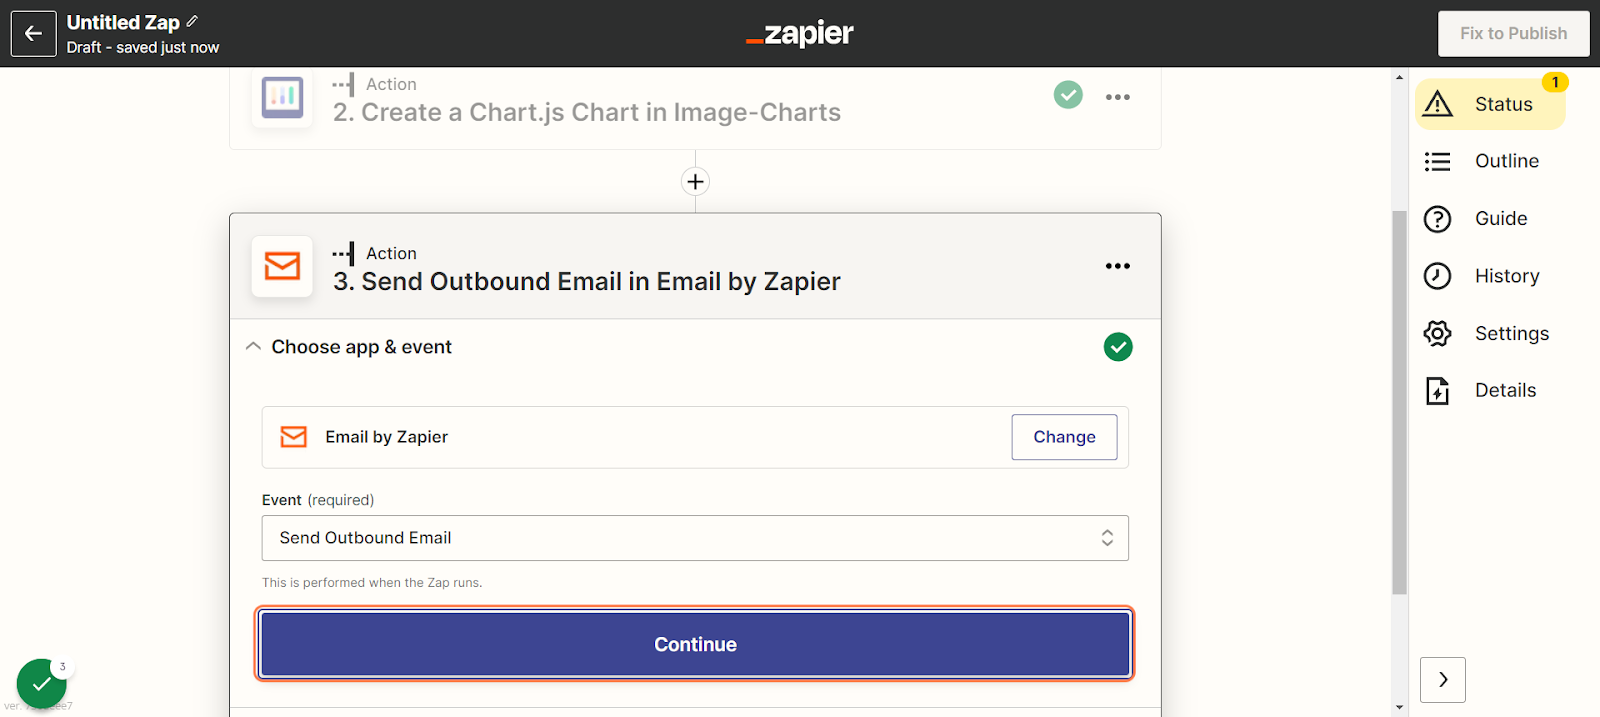
Click Continue.
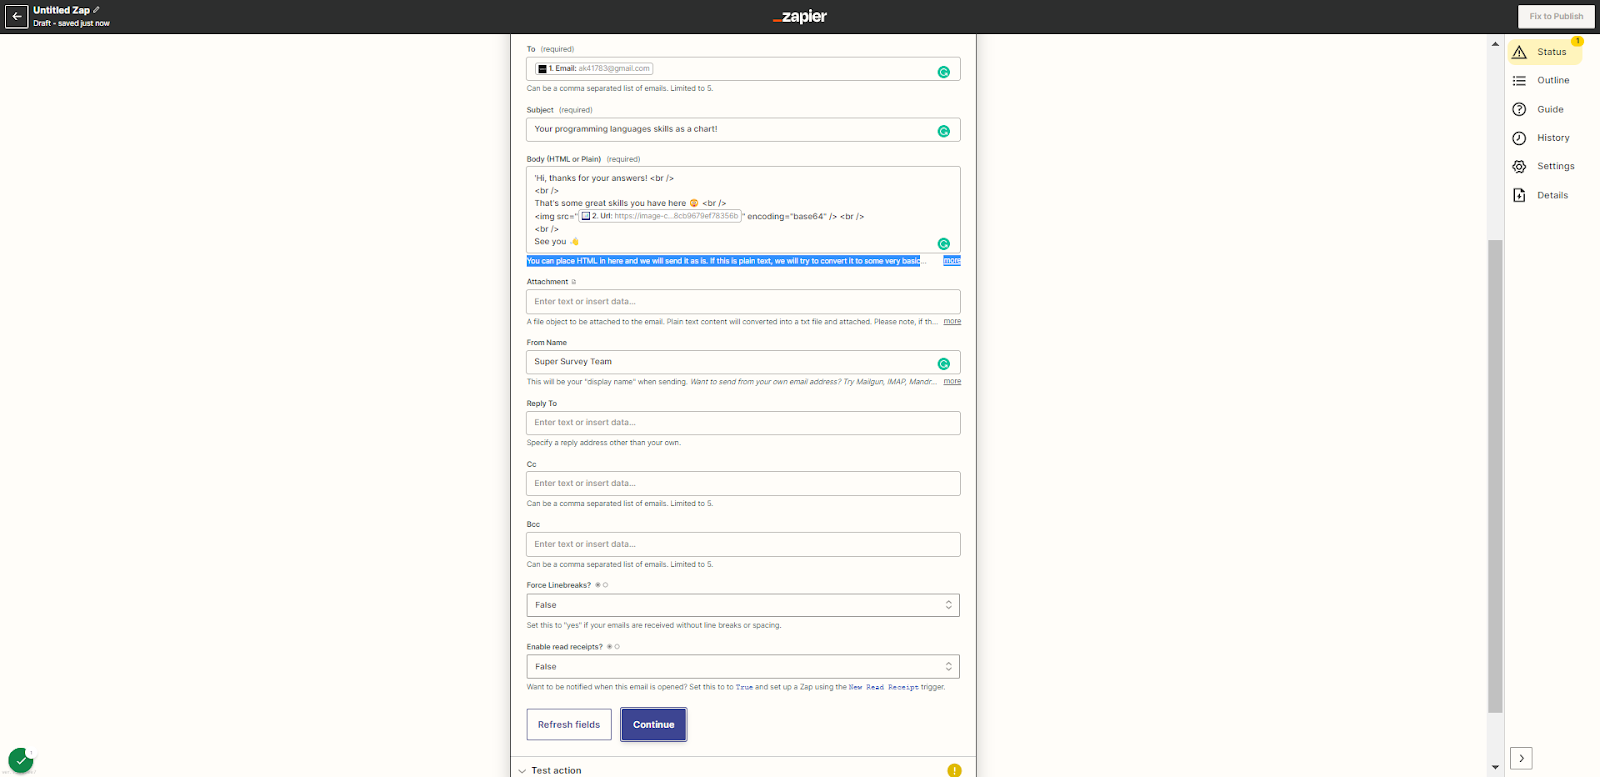
From here type your subject line and email body in the markup. Add the URL field from earlier in the body. This will be what embeds the chart in your email. Simply select the URL from the drop-down menu under the body of your email.
Add your signature and click continue.
Test the Automation

Once again, select retest & review.

If successful, you can now run the automation and receive your brand new automated email with the embedded chart!

Here's an example of how the email will look in your inbox:
.png)
A Final Word
And that is how you get started with Image Charts. Take the plunge, and try it for free today.


